R数据框:如何创建、追加、选择和子集
什么是数据框?
数据框是长度相等的向量列表。矩阵只包含一种类型的数据,而数据框则接受不同的数据类型(数字、字符、因子等)。
如何创建数据框
我们可以通过将变量 a、b、c、d 传递给 data.frame() 函数在 R 中创建数据框。我们可以通过 name() 为 R 创建的数据框命名列,只需指定变量的名称即可。
data.frame(df, stringsAsFactors = TRUE)
参数:
- df:它可以是用于转换为数据框的矩阵,也可以是需要连接的变量集合
- stringsAsFactors:默认情况下将字符串转换为因子
我们可以通过组合四个相同长度的变量来为我们的第一个数据集在 R 中创建数据框。
# Create a, b, c, d variables
a <- c(10,20,30,40)
b <- c('book', 'pen', 'textbook', 'pencil_case')
c <- c(TRUE,FALSE,TRUE,FALSE)
d <- c(2.5, 8, 10, 7)
# Join the variables to create a data frame
df <- data.frame(a,b,c,d)
df
输出
##     a         b     c     d
## 1  10        book  TRUE   2.5
## 2  20         pen  FALSE  8.0
## 3  30    textbook  TRUE   10.0
## 4  40 pencil_case  FALSE  7.0
我们可以看到列标题与变量的名称相同。我们可以使用 names() 函数在 R 中更改列名。请查看下面的 R 创建数据框示例
# Name the data frame
names(df) <- c('ID', 'items', 'store', 'price')
df
输出
##   ID       items store price
## 1 10        book  TRUE   2.5
## 2 20         pen FALSE   8.0
## 3 30    textbook  TRUE  10.0
## 4 40 pencil_case FALSE   7.0
# Print the structure
str(df)
输出
## 'data.frame':    4 obs. of  4 variables:
##  $ ID   : num  10 20 30 40
##  $ items: Factor w/ 4 levels "book","pen","pencil_case",..: 1 2 4 3
##  $ store: logi  TRUE FALSE TRUE FALSE
##  $ price: num  2.5 8 10 7
默认情况下,数据框将字符串变量作为因子返回。
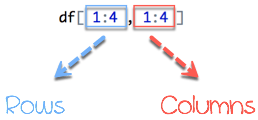
切片数据框
可以对数据框的值进行切片。我们在数据框名称前加上括号来选择行和列以返回。
数据框由行和列组成,df[A, B]。A 代表行,B 代表列。我们可以通过指定行和/或列来进行切片。
从图 1 开始,左侧代表行,右侧代表列。请注意,符号 : 表示到。例如,1:3 表示选择从 1到 3 的值。
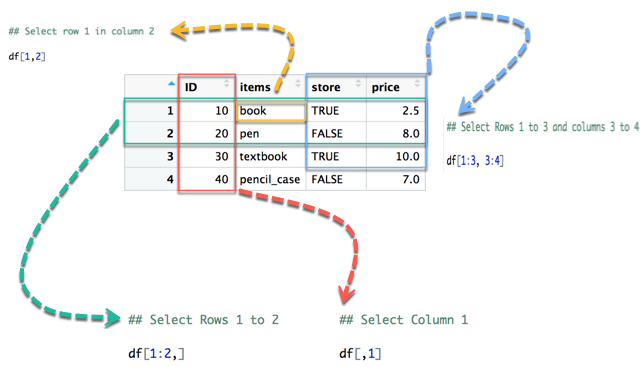
在下面的图表中,我们展示了如何访问数据框的不同选择
- 黄色箭头选择了第 2 列的第 1 行
- 绿色箭头选择了第 1 行到第 2 行
- 红色箭头选择了第 1 列
- 蓝色箭头选择了第 1 行到第 3 行和第 3 列到第 4 列
请注意,如果我们留空左侧部分,R 将选择所有行。同样,如果我们留空右侧部分,R 将选择所有列。
我们可以在控制台中运行代码
## Select row 1 in column 2
df[1,2]
输出
## [1] book
## Levels: book pen pencil_case textbook
## Select Rows 1 to 2
df[1:2,]
输出
##   ID items store price
## 1 10  book  TRUE   2.5
## 2 20   pen FALSE   8.0
## Select Columns 1
df[,1]
输出
## [1] 10 20 30 40
## Select Rows 1 to 3 and columns 3 to 4
df[1:3, 3:4]
输出
##   store price
## 1  TRUE   2.5
## 2 FALSE   8.0
## 3  TRUE  10.0
也可以选择带有名称的列。例如,下面的代码提取了 ID 和 store 两列。
# Slice with columns name
df[, c('ID', 'store')]
输出
##   ID store
## 1 10  TRUE
## 2 20 FALSE
## 3 30  TRUE
## 4 40 FALSE
向数据框追加列
您还可以向数据框追加一列。您需要使用 $ 符号追加数据框 R 变量,并向 R 中的数据框添加一列。
# Create a new vector
quantity <- c(10, 35, 40, 5)

# Add `quantity` to the `df` data frame
df$quantity <- quantity
df
输出
##   ID       items store price quantity
## 1 10        book  TRUE   2.5       10
## 2 20         pen FALSE   8.0       35
## 3 30    textbook  TRUE  10.0       40
## 4 40 pencil_case FALSE   7.0        5
注意:向量中的元素数量必须等于数据框中的元素数量。执行以下语句以将列添加到数据框 R
quantity <- c(10, 35, 40)
# Add `quantity` to the `df` data frame
df$quantity <- quantity
会出错
Error in `

lt;-.data.frame`(`*tmp*`, quantity, value = c(10, 35, 40))
 replacement has 3 rows, data has 4
选择数据框的列
有时,我们需要将数据框的一列存储起来以备将来使用,或对一列进行操作。我们可以使用 $ 符号从数据框中选择列。
# Select the column ID
df$ID
输出
## [1] 1 2 3 4
子集化数据框
在上一节中,我们选择了没有条件的整列。可以根据某个条件是否为真来子集化。
我们使用 subset() 函数。
subset(x, condition)
arguments:
- x: data frame used to perform the subset
- condition: define the conditional statement
我们只想返回价格高于 10 的项目,可以这样做
# Select price above 5
subset(df, subset = price > 5)
输出
ID       items store price
2 20         pen FALSE     8
3 30    textbook  TRUE    10
4 40 pencil_case FALSE     7