Pandas read_csv() 示例
在 Pandas 中导入 CSV
在 TensorFlow 教程中,您将使用 adult 数据集。它经常用于分类任务。该数据集可在以下 URL 找到:https://archive.ics.uci.edu/ml/machine-learning-databases/adult/adult.data
数据以 CSV 格式存储。此数据集包含八个分类变量
此数据集包含 8 个分类变量
- workclass
- education
- marital
- occupation
- relationship
- race
- sex
- native_country
以及 6 个连续变量
- age
- fnlwgt
- education_num
- capital_gain
- capital_loss
- hours_week
Pandas read_csv() 方法
要导入 CSV 数据集,您可以使用 pd.read_csv() 对象。其基本参数是
Pandas read_csv() 语法
pandas.read_csv(filepath_or_buffer,sep=', ',`names=None`,`index_col=None`,`skipinitialspace=False`)
- filepath_or_buffer:数据路径或 URL
- sep=’, ‘:定义要使用的分隔符
- `names=None`:命名列。如果数据集有十列,您需要提供十个名称
- `index_col=None`:如果为 True,则第一列用作行索引
- `skipinitialspace=False`:跳过分隔符后的空格。
有关 read_csv() 的更多信息,请参阅官方文档
https://pandas.ac.cn/pandas-docs/stable/reference/api/pandas.read_csv.html
Pandas read_csv() 示例
## Import csv
import pandas as pd
## Define path data
COLUMNS = ['age','workclass', 'fnlwgt', 'education', 'education_num', 'marital',
           'occupation', 'relationship', 'race', 'sex', 'capital_gain', 'capital_loss',
           'hours_week', 'native_country', 'label']
PATH = "https://archive.ics.uci.edu/ml/machine-learning-databases/adult/adult.data"
df_train = pd.read_csv(PATH,
                       skipinitialspace=True,
                       names = COLUMNS,
                       index_col=False)
df_train.shape
输出
(32561, 15)
Pandas groupby() 方法
查看数据的简单方法是使用 groupby 方法。此方法可以帮助您按组汇总数据。以下是 groupby() 方法可用的方法列表
- count: 计数
- min: 最小值
- max: 最大值
- mean: 平均值
- median: 中位数
- standard deviation: 标准差
- 等等
在 groupby() 中,您可以使用要应用该方法的列。
让我们来看一个与 adult 数据集的单次分组。您将按收入类型(即 50k 以上或 50k 以下)获取所有连续变量的平均值。
df_train.groupby(['label']).mean()
| 标签 | age | fnlwgt | education_num | capital_gain | capital_loss | hours_week |
|---|---|---|---|---|---|---|
| <=50K | 36.783738 | 190340.86517 | 9.595065 | 148.752468 | 53.142921 | 38.840210 |
| >50K | 44.249841 | 188005.00000 | 11.611657 | 4006.142456 | 195.001530 | 45.473026 |
您可以按家庭类型获取年龄的最小值。
df_train.groupby(['label'])['age'].min()
label
<=50K    17
>50K     19
Name: age, dtype: int64
您也可以按多个列进行分组。例如,您可以根据家庭类型和婚姻状况获取最大资本收益。
df_train.groupby(['label', 'marital'])['capital_gain'].max()
label  marital
<=50K  Divorced                 34095
       Married-AF-spouse         2653
       Married-civ-spouse       41310
       Married-spouse-absent     6849
       Never-married            34095
       Separated                 7443
       Widowed                   6849
>50K   Divorced                 99999
       Married-AF-spouse         7298
       Married-civ-spouse       99999
       Married-spouse-absent    99999
       Never-married            99999
       Separated                99999
       Widowed                  99999
Name: capital_gain, dtype: int64
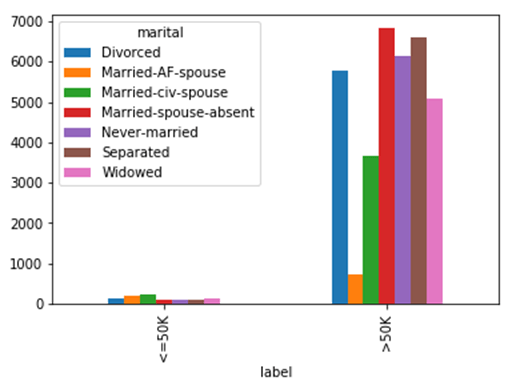
您可以创建基于 groupby 的绘图。一种方法是在分组后使用绘图。
要创建更好的绘图,您将在 mean() 之后使用 unstack(),这样您将拥有相同的多级索引,或者您可以将低于 50k 和高于 50k 的收入值连接起来。在这种情况下,绘图将有两组而不是 14 组(2*7)。
如果您使用 Jupyter Notebook,请确保添加 %matplotlib inline,否则将不会显示绘图。
%matplotlib inline
df_plot = df_train.groupby(['label', 'marital'])['capital_gain'].mean().unstack()
df_plot
摘要
- 要在 Pandas 中导入 CSV 数据集,您可以使用 pd.read_csv() 对象。
- groupby() 方法可以帮助您按组汇总数据。
- 您也可以按多个列进行分组。例如,您可以根据家庭类型和婚姻状况获取最大资本收益。